
GraphLabScience Services
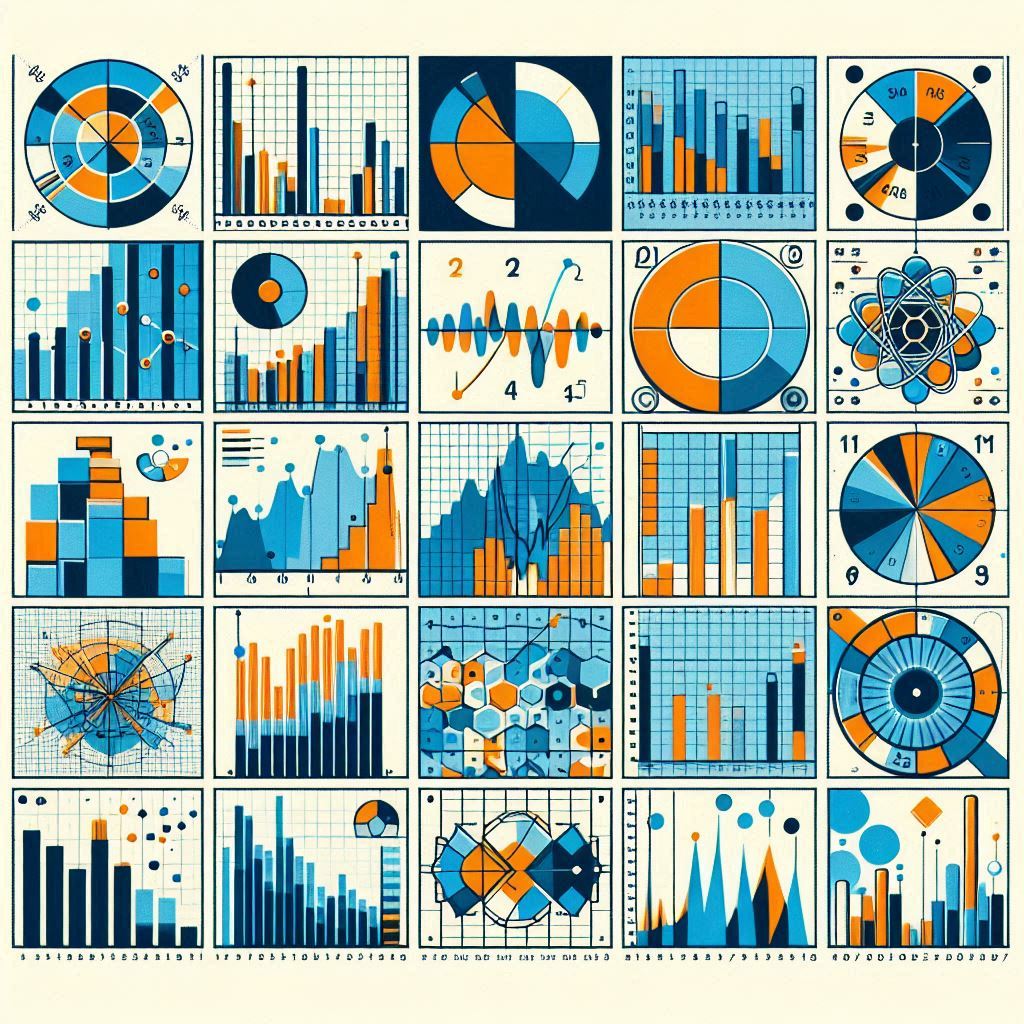
Data
Visualizations
- Large dataset analyses and interpretation
- Data visualizations and infographics
- Programming and automation of analyses
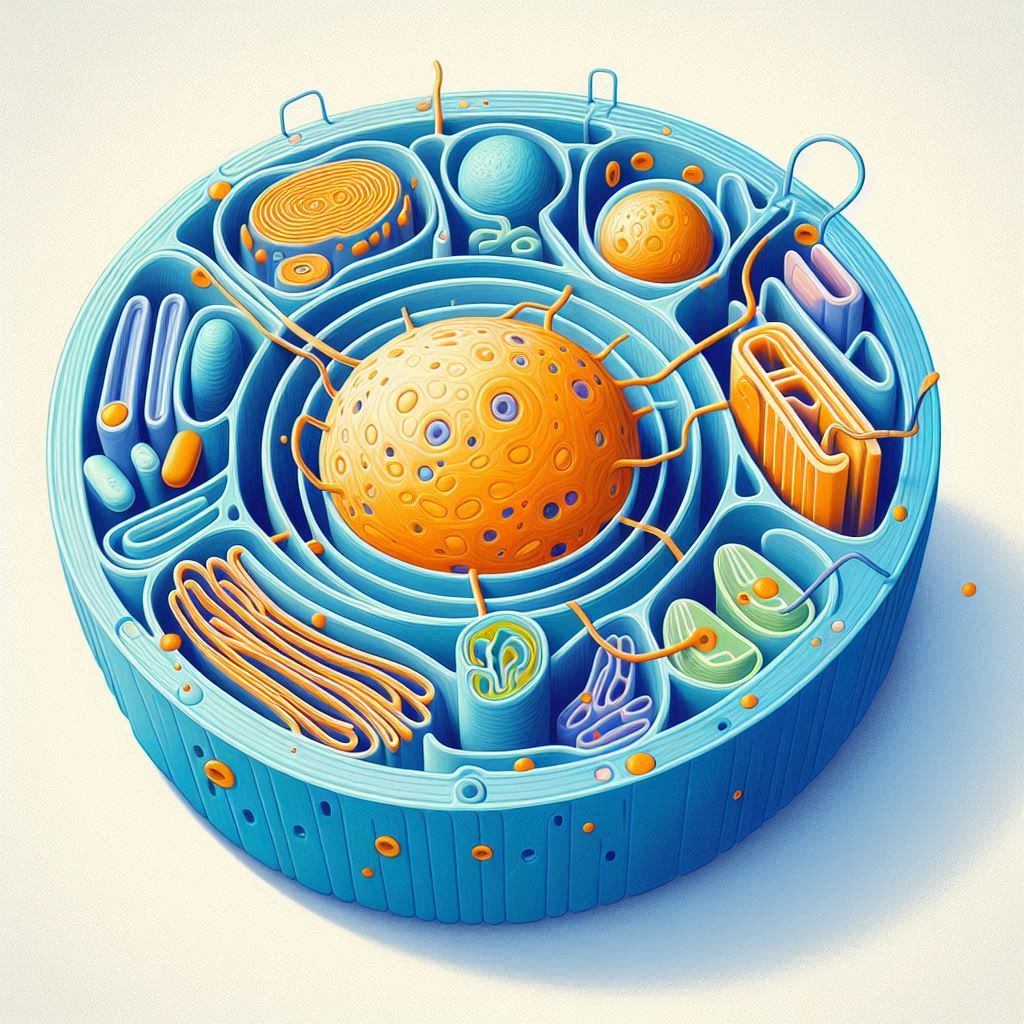
Scientific
Illustrations
- Graphical abstracts
- Illustrations of scientific contents (report, slideshow, poster, grant)
- Visuals for educational materials (brochures, websites, press)
- Branding (logo)
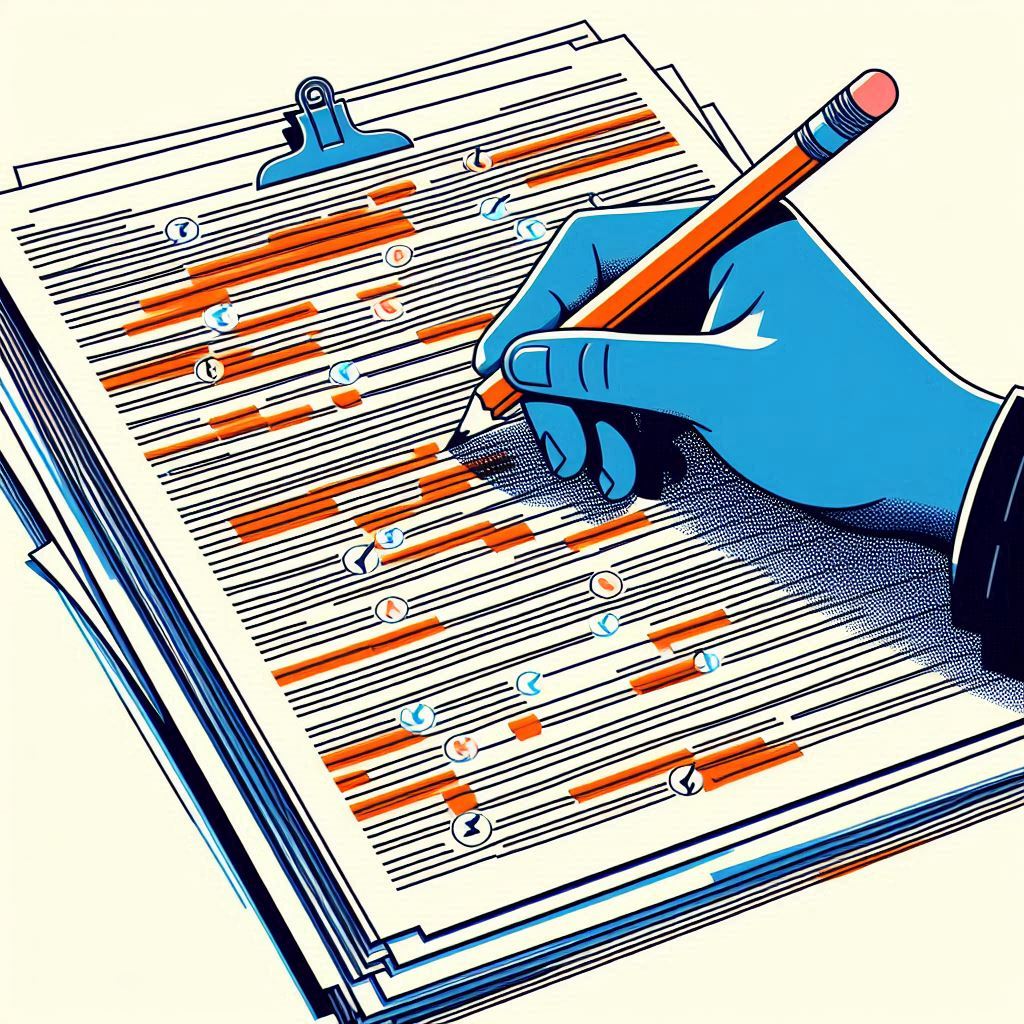
Biomedical
Writing
- Bilingual scientific content (French/English)
- Scientific proofreading and editing
- Writing targeted audience content (doctors, scientists, patients, students)
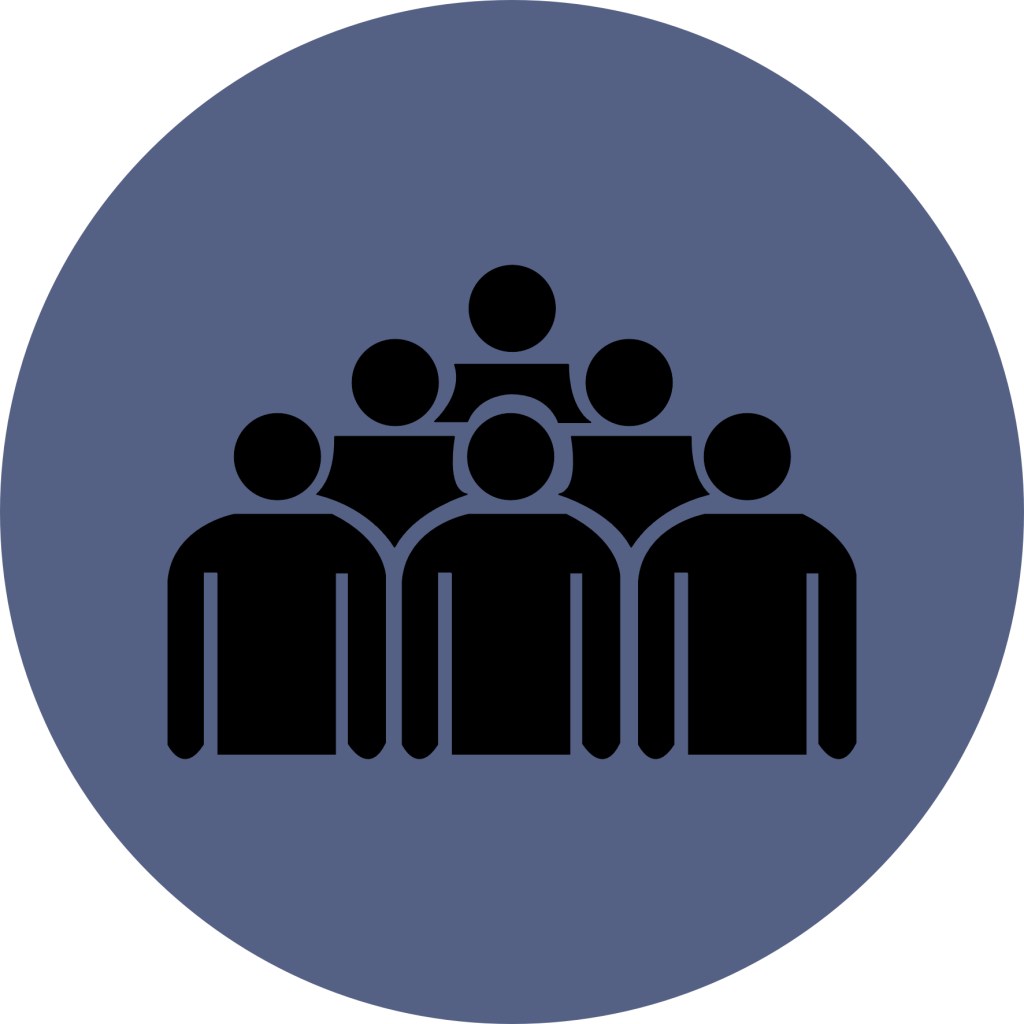
Who are our Clients?
Biomedical
Startups
Academic
Institutions

Pharma
Companies

Contract Research
Organizations

Organizers of
Scientific Events

Scientific
Press

Biomedical
Associations

Biomedical
Societies
Project Workflow
1- Reach Out

Contact GraphLabScience via the website / email.
I will set up an initial consultation with you.
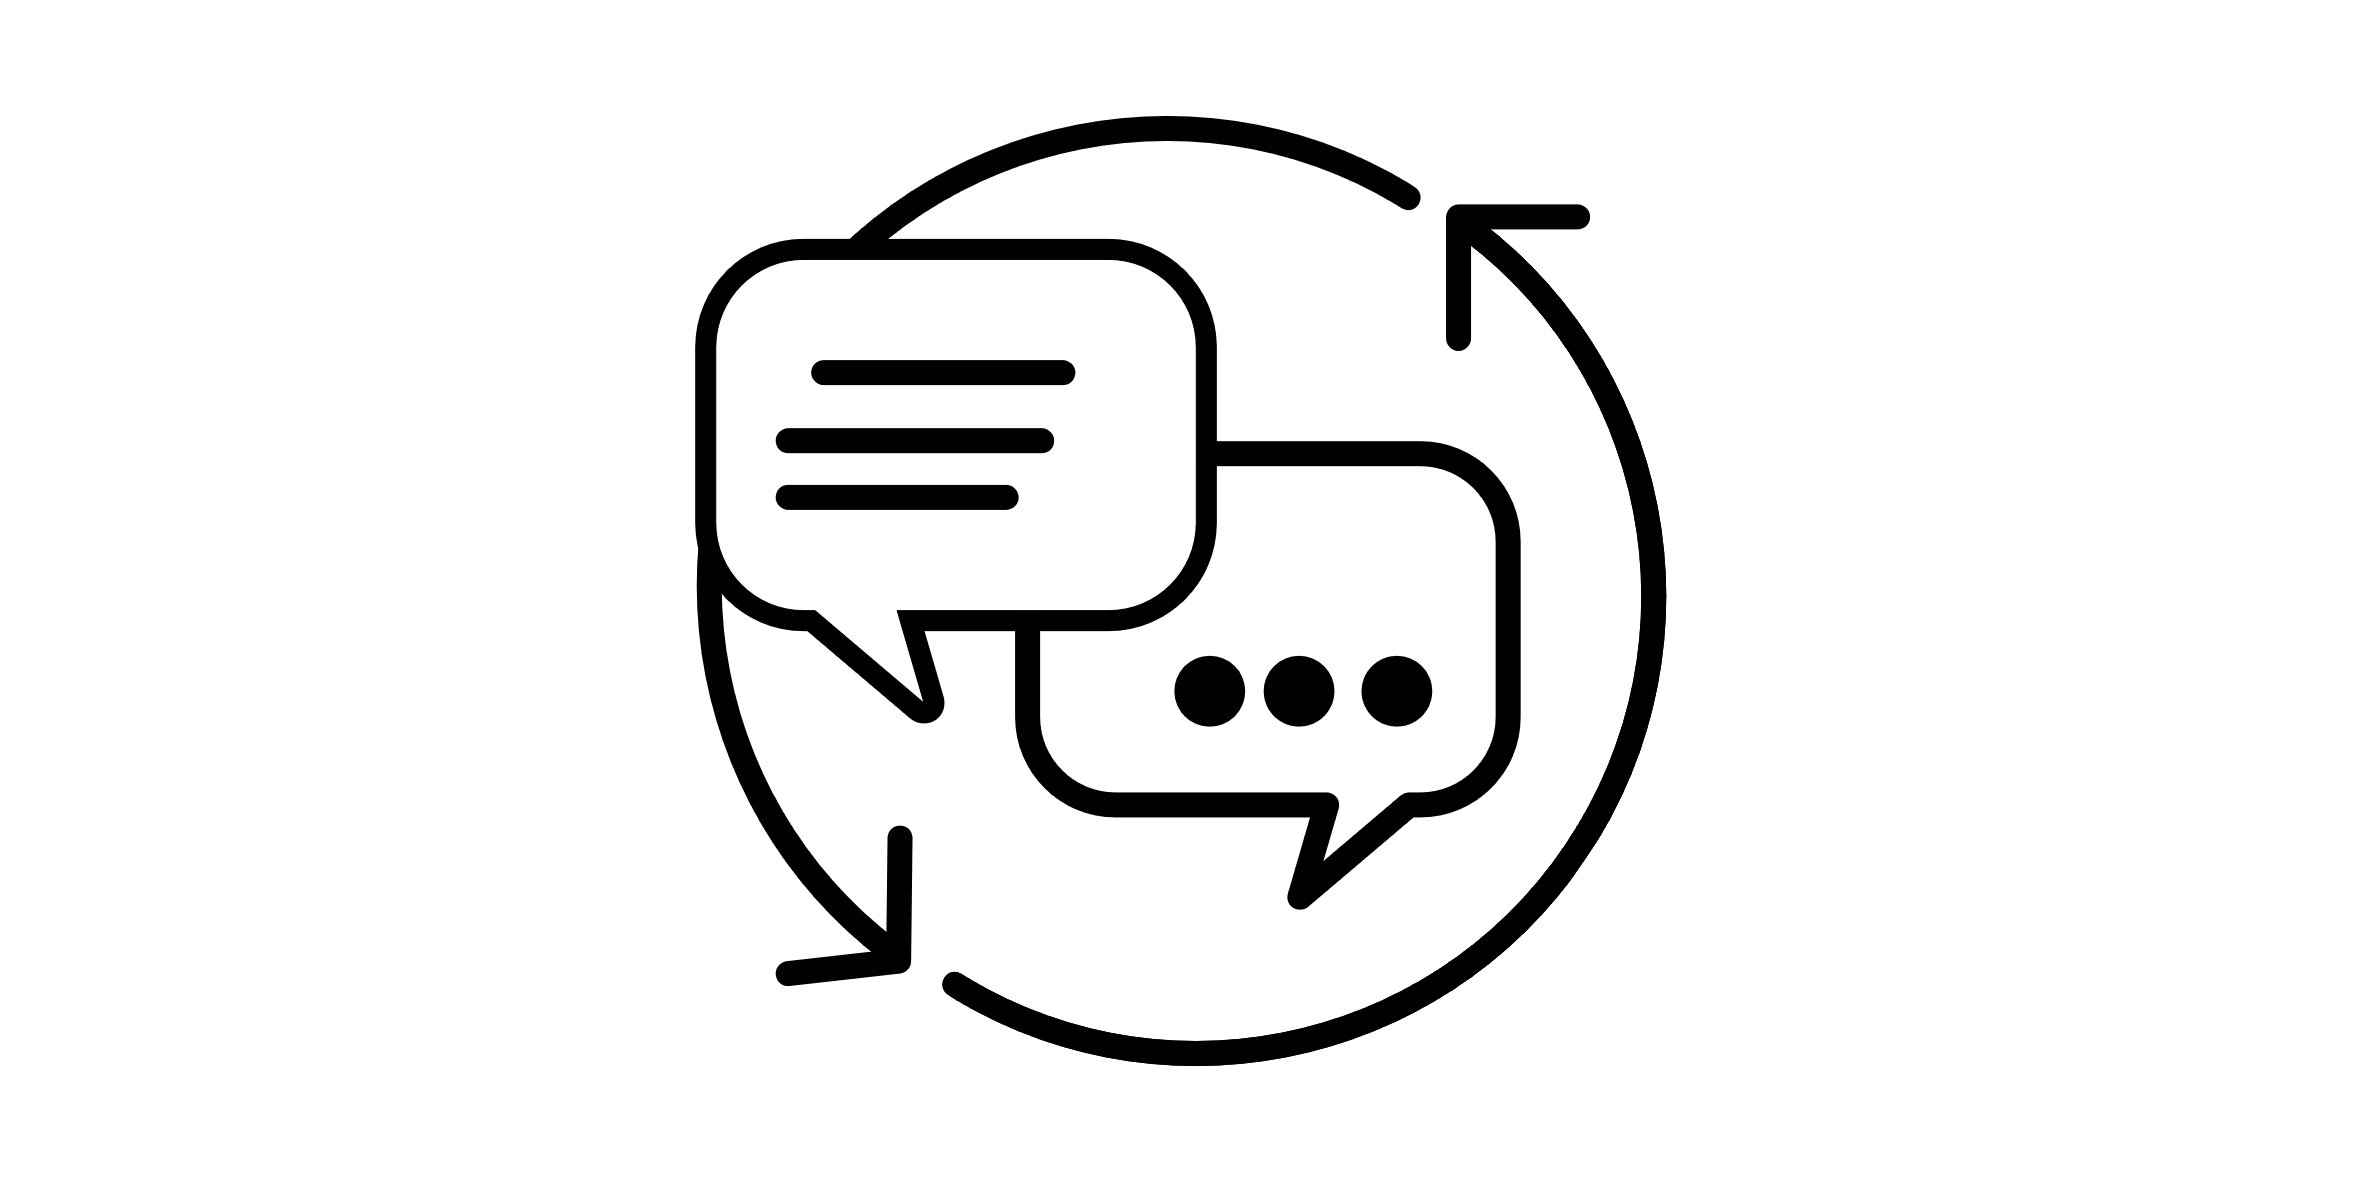
2- Discussion
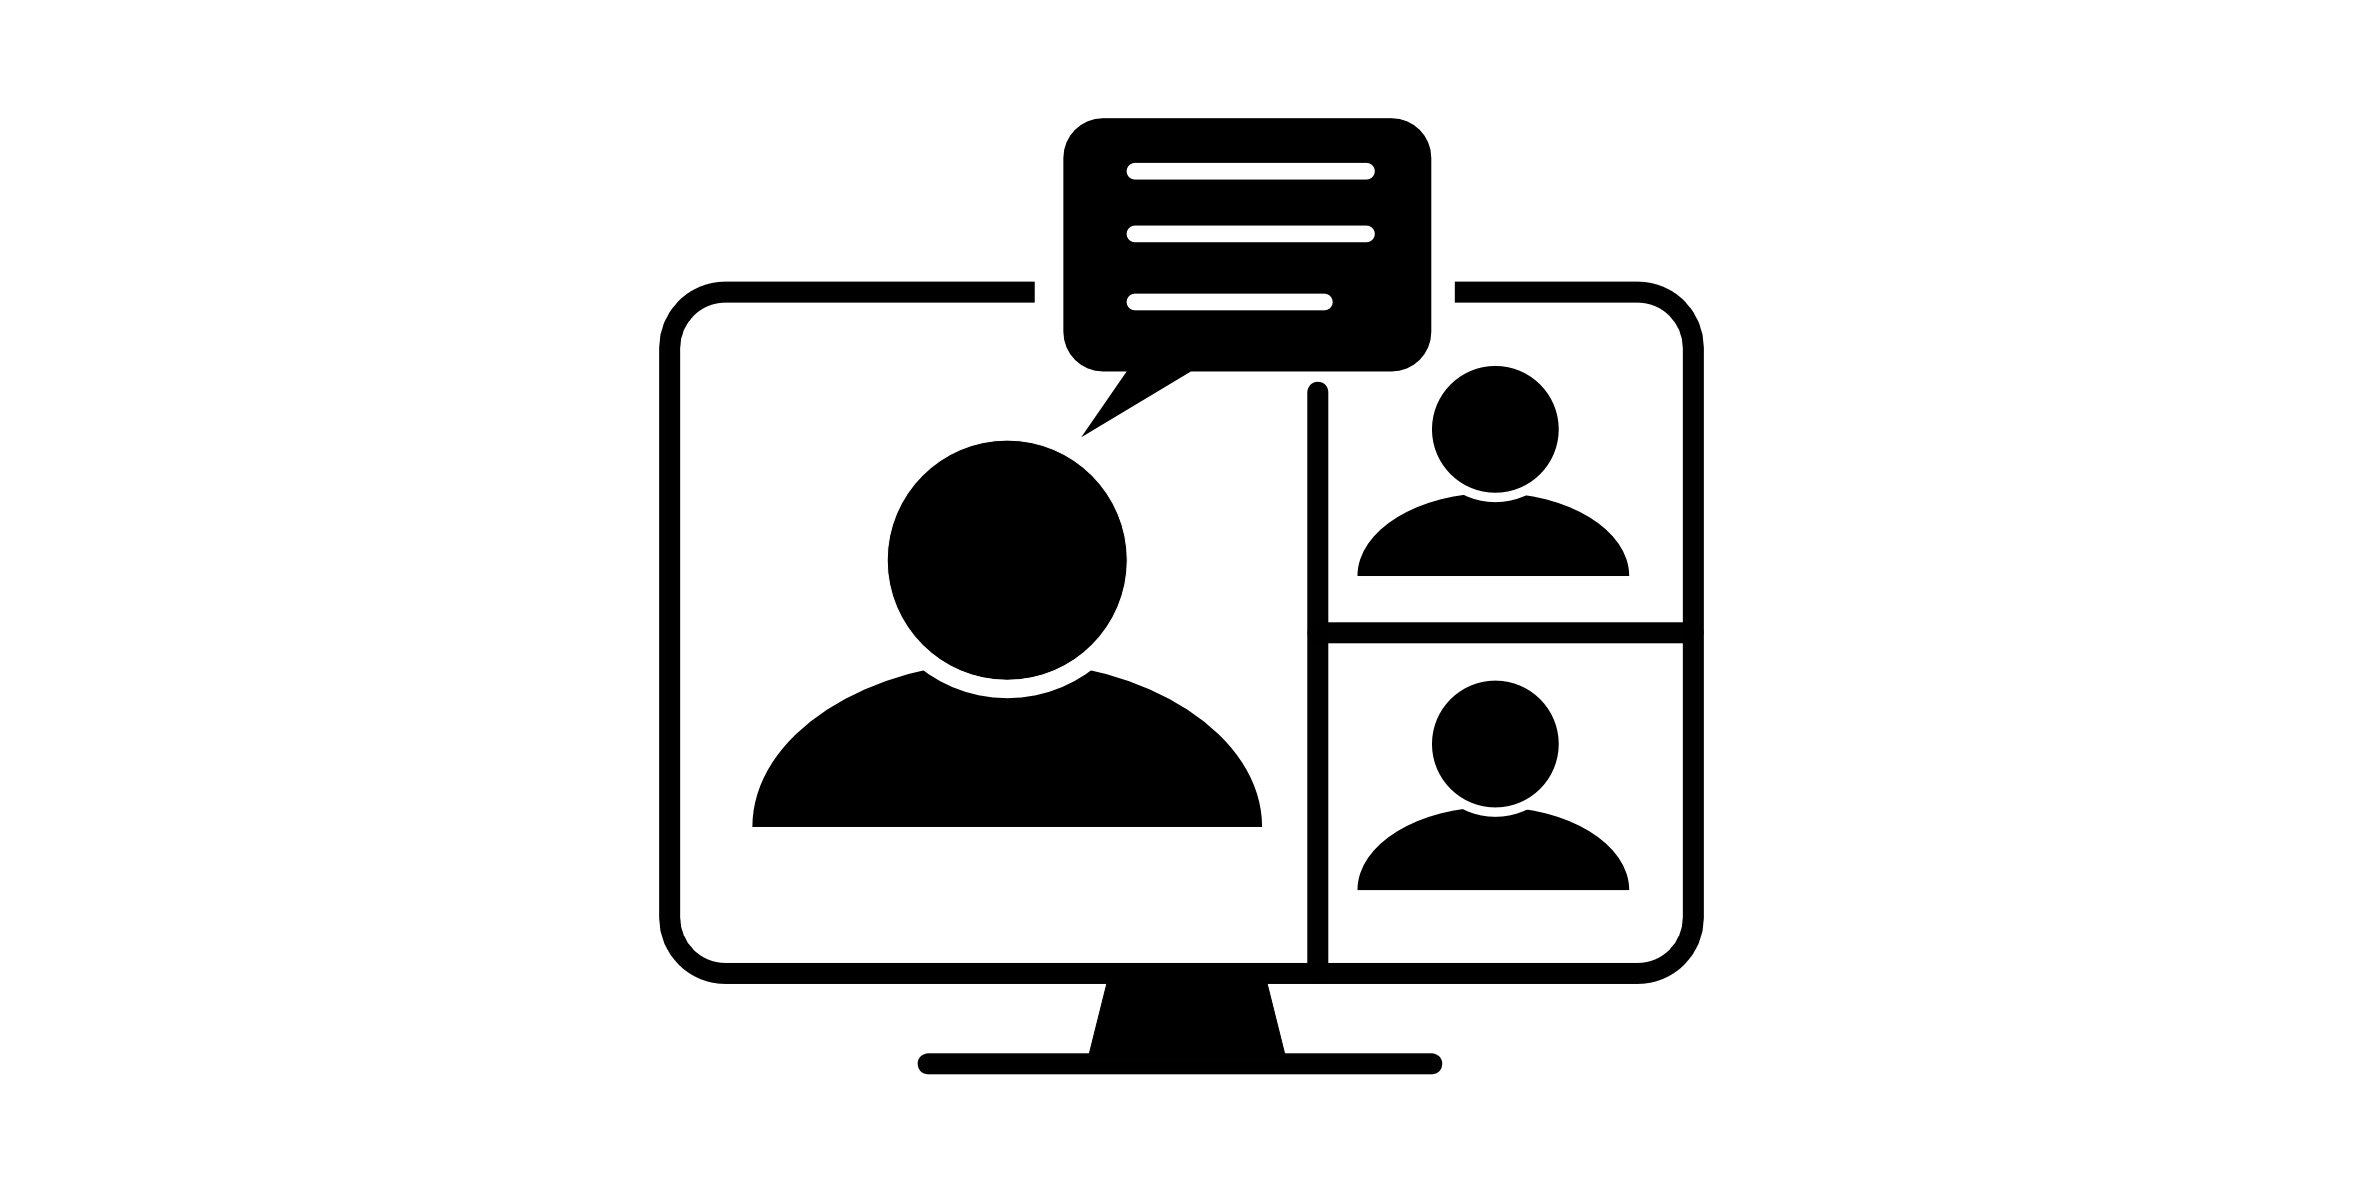
We discuss your specific goals, timeline, and requirements.
We see how GraphLabScience can assist you.
3- Project Agreement
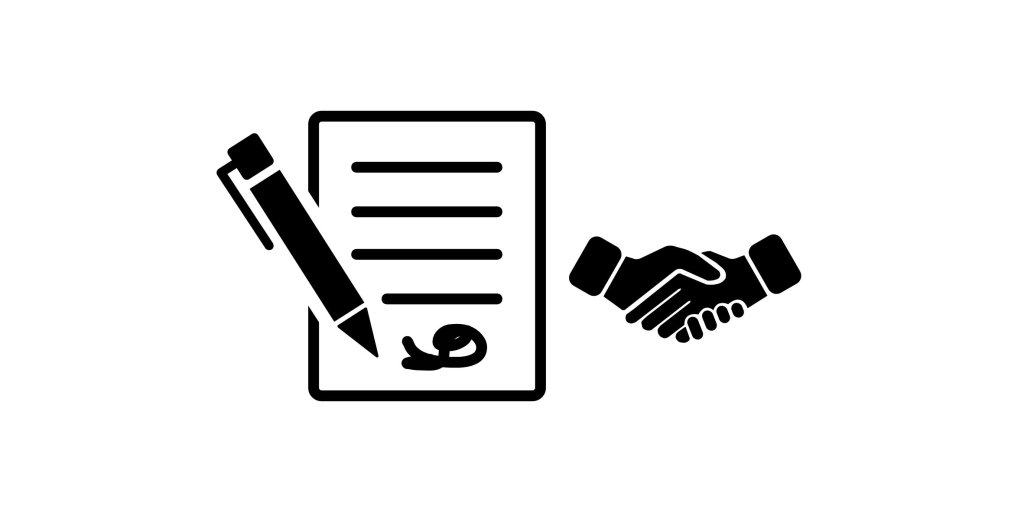
You receive a detailed project agreement (deliverables, costs, and timeline).
If you decide to move forward, we sign the contract.
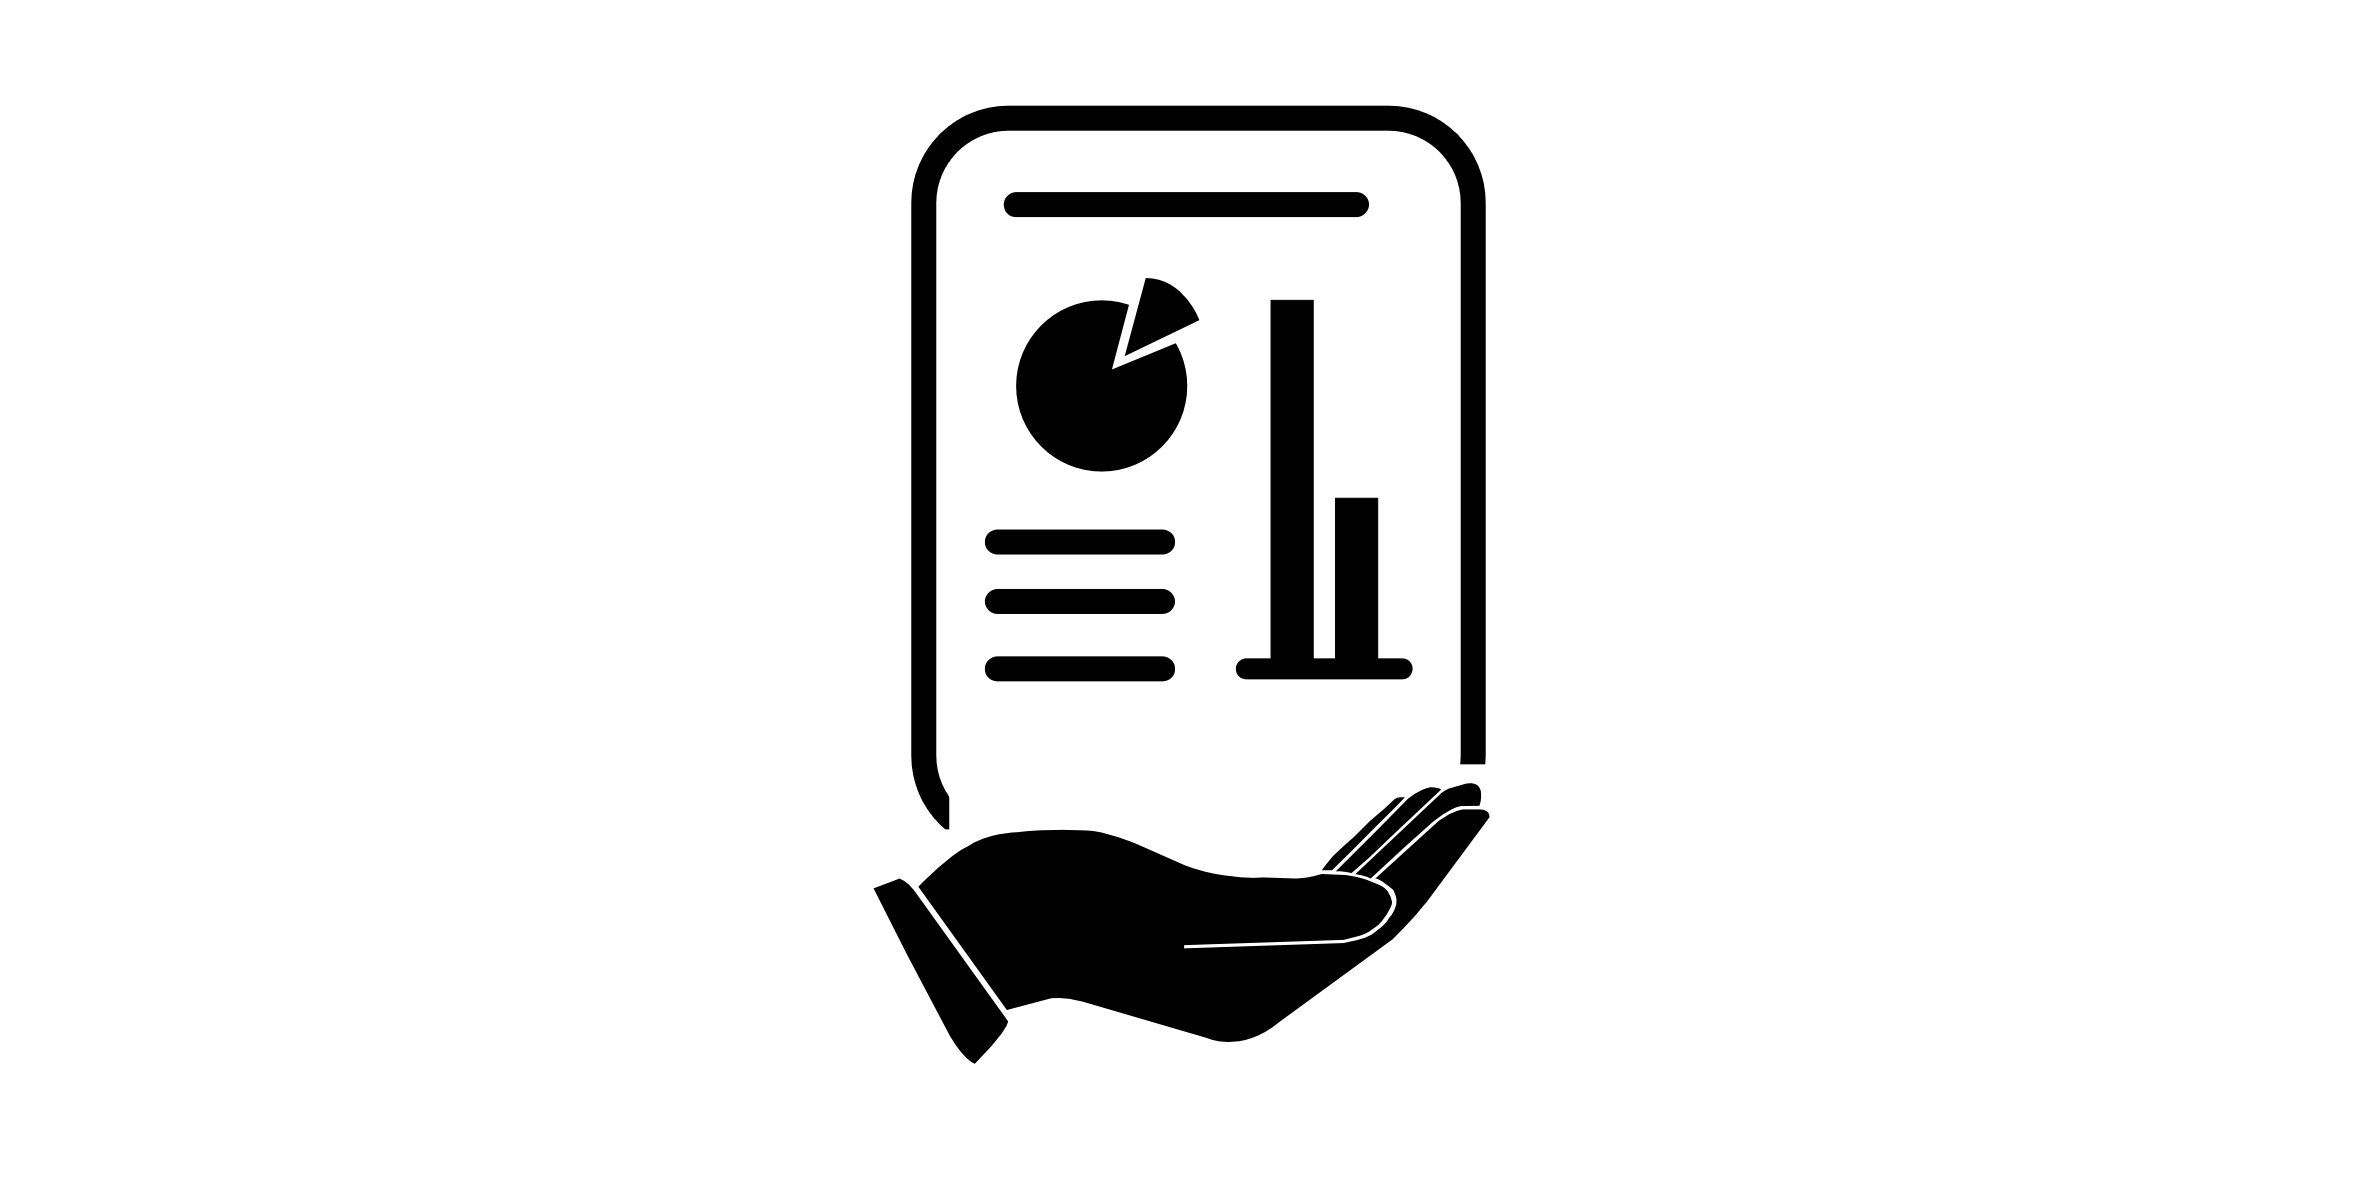
4- Project Execution
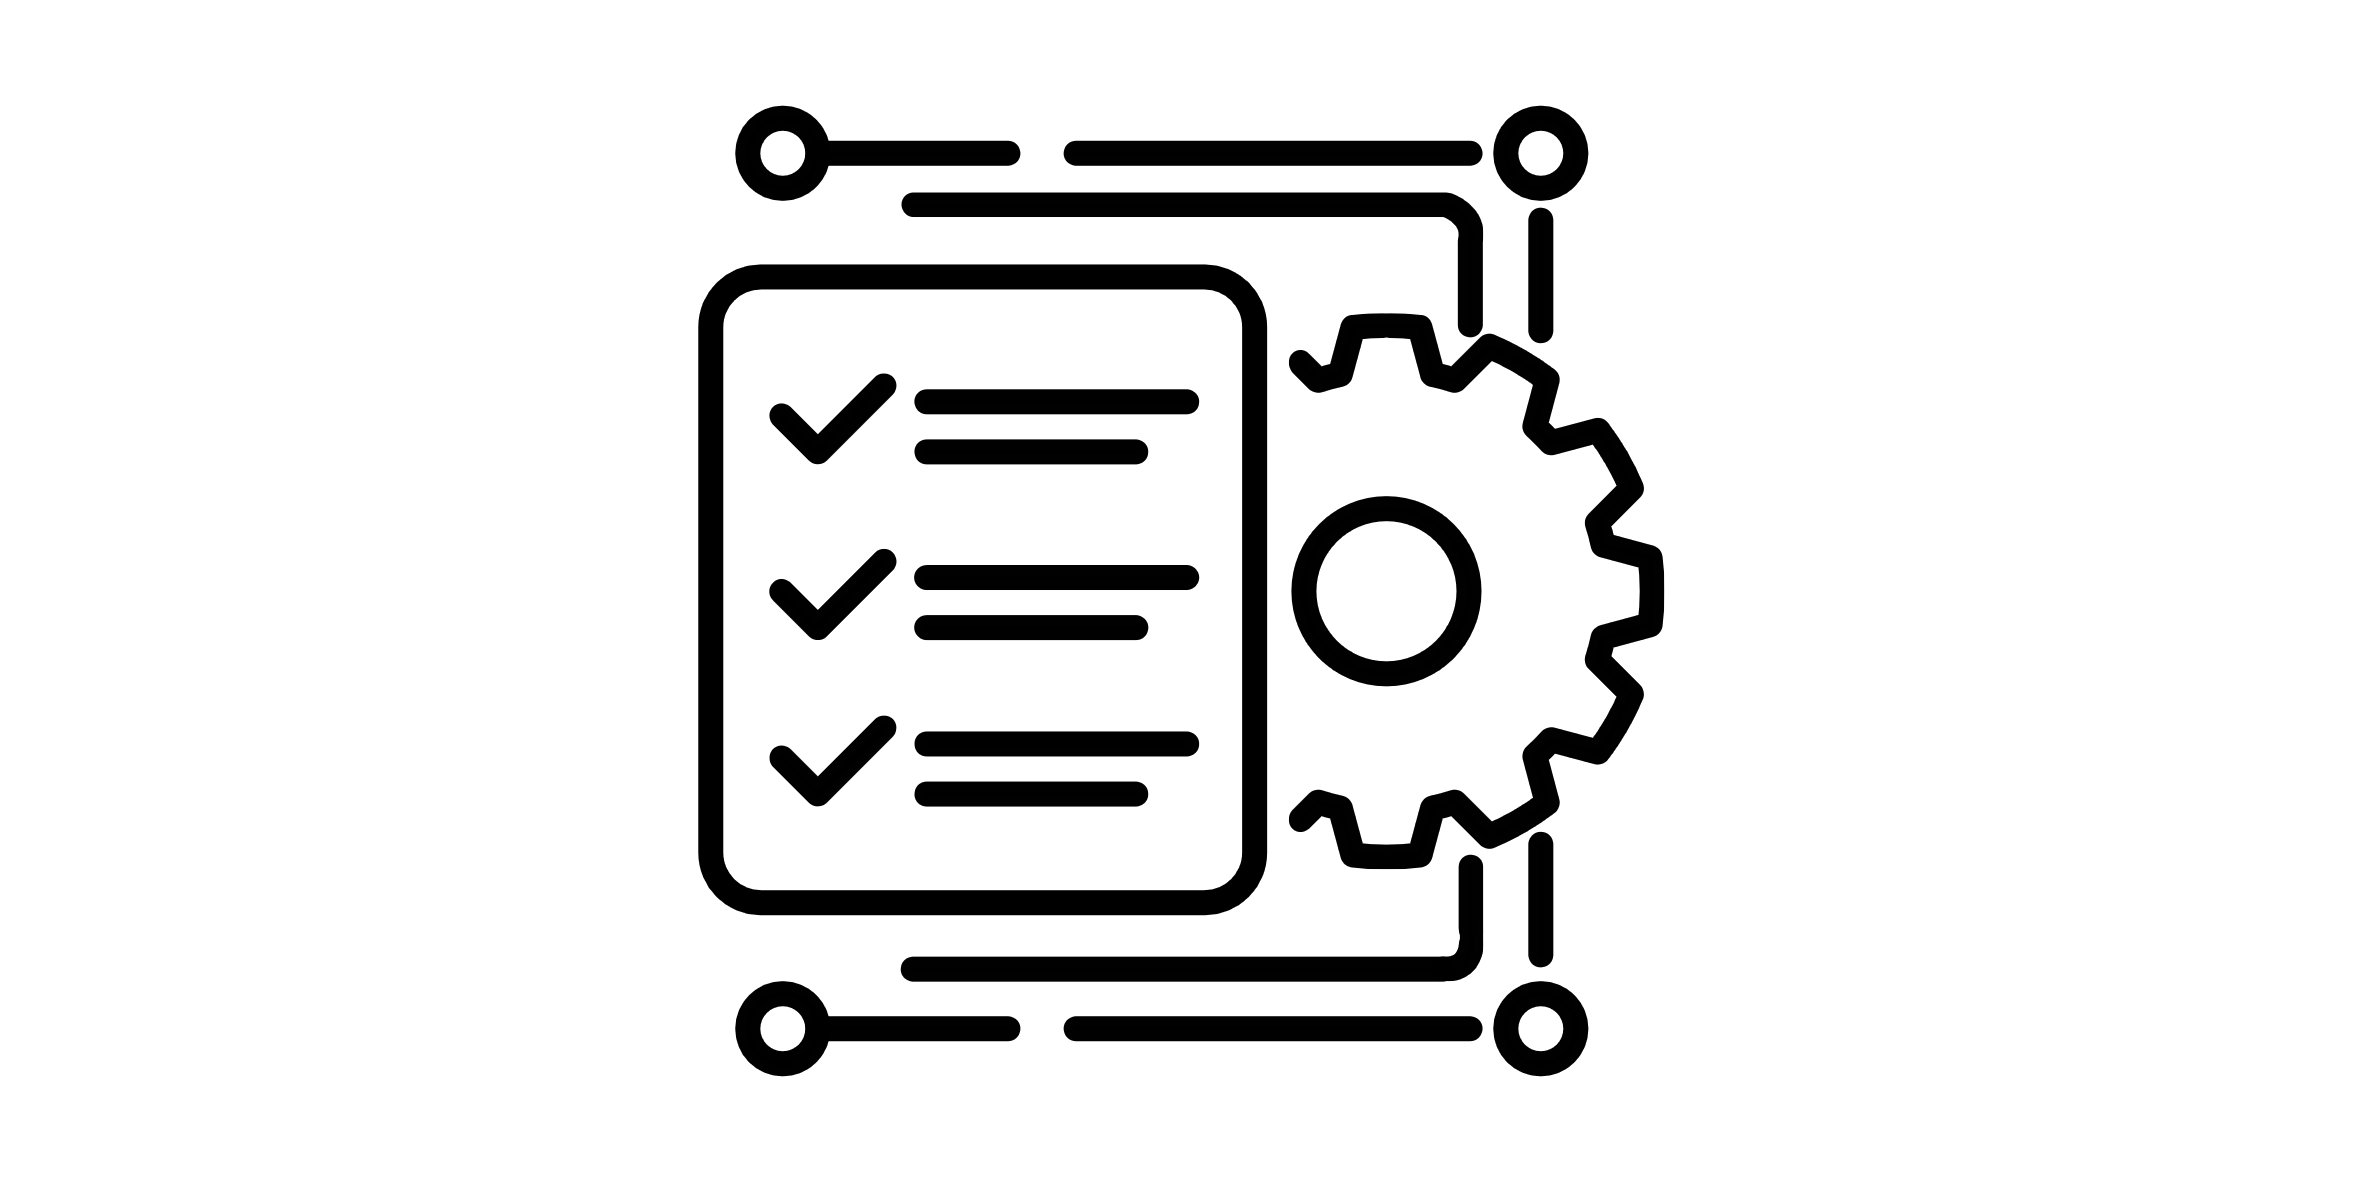
I work on your project to create the initial version of the work according to the agreed specifications.
5- Project Revisions
You receive a first version of the work to provide feedback.
I make the necessary revisions to meet your expectations.
6- Delivery & Closure
I deliver the final files and collect the payment.
Thank you for choosing GraphLabScience!
